INFOGRAPHICS
Visualizing Data
When creating data visualizations or infographics, you should begin with a clear understanding of the story you are trying to tell or the meaning you want to convey. The story should naturally arise from the data. The purpose of infographics and visualizations is to meaningfully display data that might be difficult to understand solely through text. Visualizations should accurately represent the data behind them.
Infographics
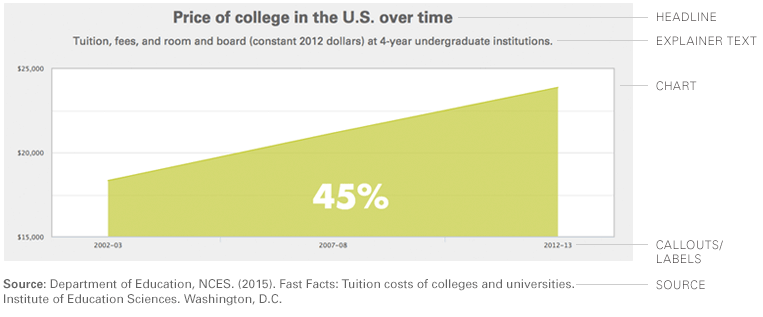
Infographics should generally include: headlines, text, callouts, charts or graphics, and data source citations.
Always cite your data source(s) in a graphic, preferably at the end or the bottom of an infographic or a collection of infographics. Optional elements include subheads, sidebars and other supporting text. A chart or graphic should be as simple as possible and no simpler, and comprise no more elements than necessary to convey the data.
Similarly, elements should be clear and help readers understand the data. Using spatially different or complex elements, such as the outlines/silhouettes of people can make it harder for people to compare and discern differences.

Design Principles
While considering all design principles is key when creating an infographic, hierarchy is the most important for Lumina Foundation graphics because it helps guide the reader through the story. Hierarchy in infographics can be conveyed through type, color and size. If every element is the same color, size or general visual weight, then none of it will stand out as important.
Using Color
Color in infographics should stick to the established Lumina Foundation color palette for consistency and visual recognition of the brand. Start with the secondary color palette for all charts and graphs. In general, use the following guidelines when considering color in infographics:
- Use color (or color contrast) to call out specific points of data or parts of the visualization and bring attention to key parts of the story.
- Avoid creating false relationships by inadvertently using the same color for elements that may not be connected.
- Avoid using contrasting colors that might be visually straining to the eye (for example, red on a blue background).
Typography
When employing typography in infographics, the general rule is that less is more. Avoid using multiple typefaces. In fact, a best practice is to use one or two typefaces in a variety of weights. Type can be used on its own or in conjunction with color to lead the eye through an infographic and help convey a sense of hierarchy (through the use of size and weight, as well as upper- and lowercase).
Interactive Elements and Transitions
Interactions and transitions can augment the infographic experience, but be mindful of using too many transitions or animations in a graphic. Simpler is better, and it is generally a good idea to keep to transitions and interactions that will help tell the story, enhance the reader experience, or call out or clarify key information in the graphic.