A BENCHMARK FOR MAKING COLLEGE AFFORDABLE
"A Benchmark for Making College Affordable: The Rule of 10" is Lumina's attempt to add clarity to the debate around college affordability. Without a clear understanding of what the ideal level of 'affordability' is...
"A Benchmark for Making College Affordable: The Rule of 10" is Lumina's attempt to add clarity to the debate around college affordability. Without a clear understanding of what the ideal level of 'affordability' is Lumina’s attempt to add some clarity to the debate around college affordability. Without a clear understanding of what the ideal level of 'affordability' is, it will be difficult, if not impossible, to achieve any national college affordability goal. With this in mind, Lumina set out to create a standard that could be the start of a conversation. An opening salvo for what affordability—student based affordability—would look like.
We convened experts in higher education and asked them to grapple with this issue. We also sought input from experts in other fields that have struggled with the issue of affordability; fields such as housing, health care, and retirement. We looked at trend data on consumer behavior and spending, and also examined current levels of investment in higher education. We reflected on some of the most oft-cited challenges with current levels of affordability, and sought out a method of defining affordability which would address these challenges.
The approach described below is not perfect. It leaves certain unanswered questions and raises new points of inquiry. It is a starting point. Our hope is that through collaboration over the next year, others will work with us to flesh out this idea; to clarify and strengthen it.
If you have feedback on the benchmark, or ideas about how to improve it, we would like to hear from you. Feel free to send us a note at AffordabilityBenchmark@LuminaFoundation.org to share your thoughts.
Though education beyond high school is more important than ever, it’s also become much more expensive. In fact, college prices have increased by 45% on average over the past decade, while household income has declined by 7%. Lumina Foundation maintains that to make post-high school education attainable, we must change the way we think about affordability.
Price of college in the U.S. over time
Tuition, fees, and room and board (constant 2012 dollars) at 4-year undergraduate institutions.
Median household income in the U.S. over time
The cost to students and families of attending college has been rising in real dollars for many years. At 2011-12 prices, students taking four years to complete a bachelor’s degree would pay a net price, on average, between $59,300 (if they started at a community college and transferred to a public four-year institution) to $111,600 (if attending a private non-profit institution).
Total net price of a four year degree by sector (1996-2012, constant dollars)
As the price of secondary education continues to climb, so does the amount of student debt. Today, total student loan debt is more than $1 trillion. The proportion of graduates with significant levels of debt has also risen, with 29% of graduates owing more than $20,000, up from 9% in 1995-96.
The amount of student debt in the U.S. is staggering, but how does it compare?
Guess which number is the highest:
 Australia's GDP (PPP)
 The cost to buy 700 Yankee Stadiums
 Student loan debt in the U.S.
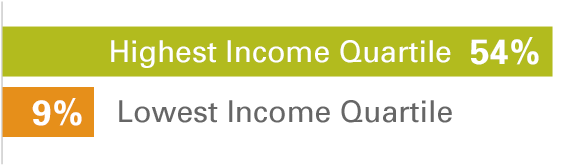
The increase in college prices has not only sent student debt soaring, but also affects whether and how students continue their education—an issue that is particularly hard-hitting among minority and low-income students.
Even when they have higher test scores, low-income students enroll in college at lower rates than their higher-income peers, have lower persistence rates, and are less likely to graduate.
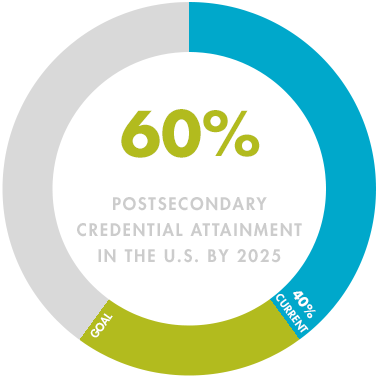
Percentage of Americans who hold degrees, certificates, and other credentials
THE AFFORDABILITY BENCHMARK
To reach the goal of 60 percent of Americans with high-quality degrees, certificates, and other credentials—we must take a student-centric approach.
Simply, a new college affordability model should focus on what students can afford to pay, not what college should cost. This new model begins with what students are bringing to the table, and suggests that the system be built around their needs.
A new college affordability benchmark should
- Focus on transparency of prices and subsidies
- Promote alignment between federal, state & institutional systems
- Include embedded student incentives
THE RULE OF 10—THE NEW MODEL
The Rule of 10 considers three major components to provide a general guideline for how affordable college SHOULD be.


THE RULE OF 10 IN ACTION
The following are examples of how the Rule of 10 could be applied in different family and student lifestyle situations. In each scenario, a student might also expect to contribute an additional $14,500 ($3,625 per year) from work over the course of four years to the total cost of attendance (including living expenses) for an educational program.
ADULT STUDENT
A single adult returning to college after a lull may be making $30,000 on average over the course of 10 years before returning to school. They would be expected to contribute $53.83 monthly, $646/year or $6,460 to their post-high school education.

SINGLE PARENT
A single parent with one child making $35,000 might only be able to contribute $26/month or $3,140 over the course of 10 years. This would mean that he should not have to pay more than $3,140 for a total degree program.

Average Family of four
A family of four consistently making an average of $50,000 could afford to contribute $1,500 to a college education, or $12.50/month. If the family had not saved this amount by the time a student was prepared to enroll in college, a student should have to take on no more than $1,500 in student loans, which could be repaid with 10% of his or her discretionary income after college.

Upper-Middle-Income Family of four
A family making an average of $100,000 might be able to contribute $51,500 (saved over 10 years), or about $429/month. If they had only saved $10,000 to contribute to college at the time of a student’s entry to college, the student (or family) might be able to take on up to $41,500 in loans, which would be repaid with 10% of their discretionary income after college.
The affordability benchmark is calculated based on the reasonable assumption that individuals and families making above 200% of the poverty rate can afford to save 10% of their income. The poverty rate differs by family size, so that larger families receive a larger income exclusion than smaller ones.
TRY IT YOURSELF
Who are you?
Family
Single Parent
Adult Student
How big is your family?
What is your household income?
This draft merely provides an outline: the benchmark does not reflect any declaration of how current policy constructs should be changed—it does not seek to set loan limits, tuition structures, or state subsidy amounts, for example. Some people can’t afford to save anything for college, and it is our imperative as a society concerned with equity, to make sure that these individuals have access to high quality post-high school education options, despite these economic barriers.
Sources
- Department of Education, NCES. (2015). Fast Facts: Tuition costs of colleges and universities. Institute of Education Sciences. Washington, D.C.
- Department of Education, NCES. (2015). Student Loan Volume and Default Rates. Institute of Education Sciences. Washington, D.C.
- Department of Education, NCES. (1997). National Postsecondary Student Aid Study (NPSAS: 96), Methodology Report. Institute of Education Sciences. Washington, D.C.
- Bailey, M. & Dynarski, S. (2011). Gains and Gaps: Inequality in U.S. College Entry and Completion. NBER. Cambridge, Mass.