
Facts are friendly, the saying goes. And often, the friendliest ones are the facts you can easily look up yourself.
That’s the thought behind the new edition of Lumina Foundation’s report on educational attainment beyond high school, Stronger Nation.
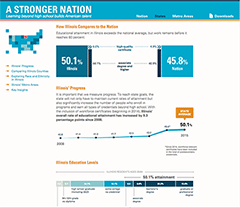
The big picture: Just under 46 percent of Americans ages 25 to 64 have earned college degrees or workforce certificates. And while there’s good news—attainment is increasing among all races and ethnicities—large gaps persist.
 New data tool for 2017 is at strongernation.luminafoundation.org.
To get at the details, we’ve turned the annual report, which usually runs 250 pages or more, into a searchable online tool that anybody can use, at http://strongernation.luminafoundation.org/.
It’s an interactive data visualization, and you can make it what you want. We’ve been encouraging people to play with this—you can’t break it.
For example, you might go to Stronger Nation, pick your state and arrange the data in ways that make sense to you—by county, by attainment level, by population. Or you can compare states nationally to see which ones are doing especially well for attainment, how the highest performers compare when it comes to population and other factors.
Being able to see instant answers with a simple click instead of poring through a 250-page book makes the data more interesting. It comes alive that way. And if you’re somebody who loves paper, then whatever you arrange on the site—however you decided to look at the data—you can easily download and print.
It’s a much more intuitive way to look at information, and you can use the site on your phone, other mobile device or desktop.
As you can imagine, there’s plenty to discover. Lumina supports the goal of helping the nation reach 60 percent attainment by 2025. But while every state has increased its attainment rate since 2008, we’re still not making enough progress to get there.
The good news: Goals matter. The report shows that of the 26 states that increased their rates each year from 2011 to 2015, 21 have specific attainment goals.
And this year, while we’re talking about attainment at a high level, we’re also looking at indicators toward attainment, disaggregating the data by race, ethnicity, and age, where possible.
It turns out that we’re seeing some sizeable equity gaps in the data. We think that’s an important message for everybody to see, especially policymakers. And with this new tool, seeing the data is much easier than before.